Last year I attempted to answer a question posed by Jeff at MCDOT by doing something strange - by building a Google Map that shares the title of this blog, Montgomery Sideways. His question was; "Can you identify the specific locations of the utility poles that may be ADA violations." In response, I looked to Google Maps and discovered how great a tool it could be in identifying impediments and compiling information.
The County has insisted on a data-driven process in solving pedestrian problems, which is generally commendable. I have tried to provide information to support the need for more data on pedestrians. In the case of this map, I have tried to build a model for tracking pedestrian infrastructure. I learned this tactic during a Complete Streets Project in 2008. Nothing works to show trends and patterns like a visual depiction of compiled data. Nothing reveals neglect better, either. But, my model is admittedly very rough, as it reflects my limitations - both visually and intellectually. I continue to hope that what I have done gets noticed by someone who can bring more thought and expertise to bear.
The data collected by MCDOT and SHA is usually one-sided. They can tell you how many pedestrians have come into contact with vehicles because they know about vehicles. When it comes to pedestrians, they know precious little. They don't count them - at least not in a scientific way - until after an injury or death.. But we can count obstructions, and unlike people, we can pin-point them on a map.

After that it all seems raher simple to me. You find them, mark them, and fix them. Ocassionally you look to the map to see that the number of red dots is smaller, and the number of green dots is larger. Simple, right? Apparently not.
The data changes, so any ad hoc attempt to gather data provides only a snapshot of conditions. Any one-time count is just that. In order to truly judge pedestrian infrastructure, the observer must participate in using the system. Data must be generated by actual users. Things must be inspected from a pedestrian viewpoint. It must be a collection of reports by many people throughout the year - during varied times and under different conditions. MCDOT and SHA should participate in this electronic conversation with pedestrians. The data must be available in dynamic form - such as a Google Map.
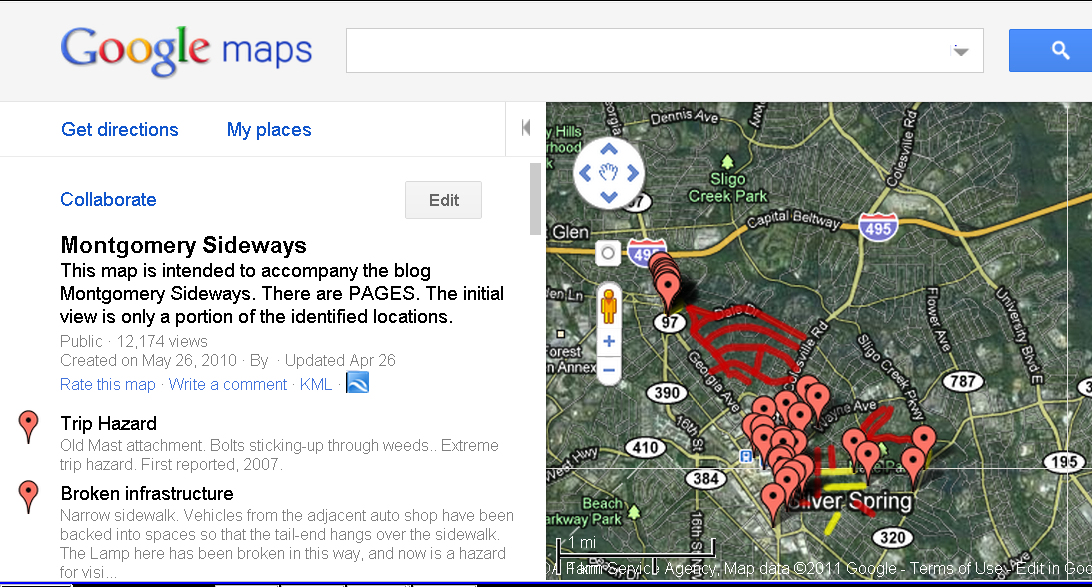
View Larger Map
It seems to me that smart phones could be the answer to this need for data from users. If I knew how to write Apps, I would have already written one that allows a pedestrian with a smart phone to mark their location and submit a simple report containing a photo/video of the situation. The data would automatically be added to a map thart shows the location and gives access to additional information. MCDOT could use such a map to address problems, and could rate each report for accuracy. Each reporter would receive a rating, and fakers would soon be weeded-out. Each mark could be updated by MCDOT to indicate its status.
Pepco contractors, MCDOT and SHA contractors, USPS carriers, and others could use the App to report problems on regular routes. Data could also be added by PC for those without a smart phone.
A pilot project that features similar usage of the technology is underway at The University of Maryland, College Park.
Other localities in the US are trying this for bicycles, but Montgomery County would be one of the first to do this for pedestrians. I have provided a crude example in Montgomery Sideways Google Map, but there are flaws in my model that need working-out. The data I have entered those many months ago is old now. Many of the street views are2-or-more years old. Someone called in 311-reports based on my map entries, and I think it even worked - but I don't know the addresses, and the reports do not cooperate with my map, so it is useless to try and figure it all out. It took a long time to enter the data on the map, and I can't imagine tryig to reconcile the new, 311-data with he old Google map. Talk about torture...
Still, I believe that the right app combined with the right map could create a really useful tool for MCDOT. One that could change the approach to pedestrians and make our streets safer and more accessible to pedestrians. Data from users is the key to knowing so much about pedestrians and gauging the success of our pedestrian accessibility efforts. I have proven that it is possible to get information from people about pedestrian infrastructure. I have already proven that you can gather the data easily,and quickly, and that the data can be displayed in a number of dynamic ways to reveal numerous trends and problems.I have pointed to technology that already exists tand is ubiquitous that can allow pedestrian infrastructure users to report on conditions. The only thing I have not done is write the App, and I don't know how to do that.
But, a member of the County's Pedestrian and Traffic Safety Advisory Committee is working on that right now, and there is a little bit of money to try something out. I am just waiting to see what happens. I will let you know how it turns out...
All of the pieces are in place.All we need now is the foresight and will to pull it off. The possibilities are amazing!
No comments:
Post a Comment